👋Hello, I am Henrique !
My passion is to understand business models and build impactful Analyses.
I believe that data-driven decisions can change the world.

“ Learn as if you will live forever,
live like you will die tomorrow.”
— Mahatma Gandhi

Henrique is ...
A positive person who seeks to make the best out of every experience. Is also super excited about new experiences and improve as person and professional.

Values in life:
Meeting new people and learning new ways to perceive the world is always exciting for him. Believes that empathy and understanding are the core of a better world.
Values in work:
Trust, responsibility, and transparency are essential to power synergy and collaboration in professional relationships. Also, being clear and concise reinforces efficiency in business interactions and solutions.

Experience
Proven experience working with Data Analysis and Data Pipelines with a in fast pace learning, has presented analysis to C-level executives, helped build a data ecosystem from the 0, and led tech teams of up to 6 people.
My Portfolio Section
Candidates ETL and Dataviz challenge
A challenge to create a ETL process to load a CSV file into a database and then consume this data with a jupyter notebook and create visualizations
Spark
Skills
Professional experience

Google Sheets

Python

Excel

Spotfire

SQL

Airflow

Spark

GCP

CSS

HTML

Javascript
Project experience

React

R

MATLAB

SCSS

C
Experiences

Kanastra
, UberlandiaFulltime - 06/2022 to nowData Engineer - 01/2023 to Now
- The team must create data models and pipelines to supply data to the analytical layer consuming data from many different sources and consolidating them in a trusted layer
- Built pipelines following a 3-layer architecture (Bronze, Silver, Gold or Raw, Cleaned Trusted). These layers were implemented in the GCP in the Cloud Storage and Bigquery.
- Used airflow and dags to orchestrate tasks at different processing stages. Also, yaml config files to easily recreate processes with similar configurations.
- Used distributed processing with pyspark and GCP Dataproc to read, transform, and load data.
- Implemented Merge DML in Bigquery to sync tables to new data
- Created and maintained tables in the analytical layer for Data analysts' consumption.
- Helped set up local airflow with docker to replicate the production environment and test scripts before pushing new code
- Helped create CI/CD workflows in GitHub and Makefile instructions for the team.
Sr Data Analyst - 06/2022 to 12/2022
- The first Data Team member. Helped structure the foundations for the company's data ecosystem. Our team delivered analytics to end customers about the health of their investment products, quality, and reliability are highly demanded
- Created Data Visualizations in Metabase for embedded applications to the end client for +5 deals.
- Defined Superset as a new BI tool for better scalability of the developments and improved aesthetics with CSS injections.
- Modeled core business entities for general use purposes in dashboards and analytics.
- Refined business rules and KPIs requirements with the investment team and became a reference in the data team in Brazilian financial market knowledge.
- Created complex SQL queries (CTEs, Window Functions, Aggregations, subqueries) for charts and visualizations.

Algar Telecom
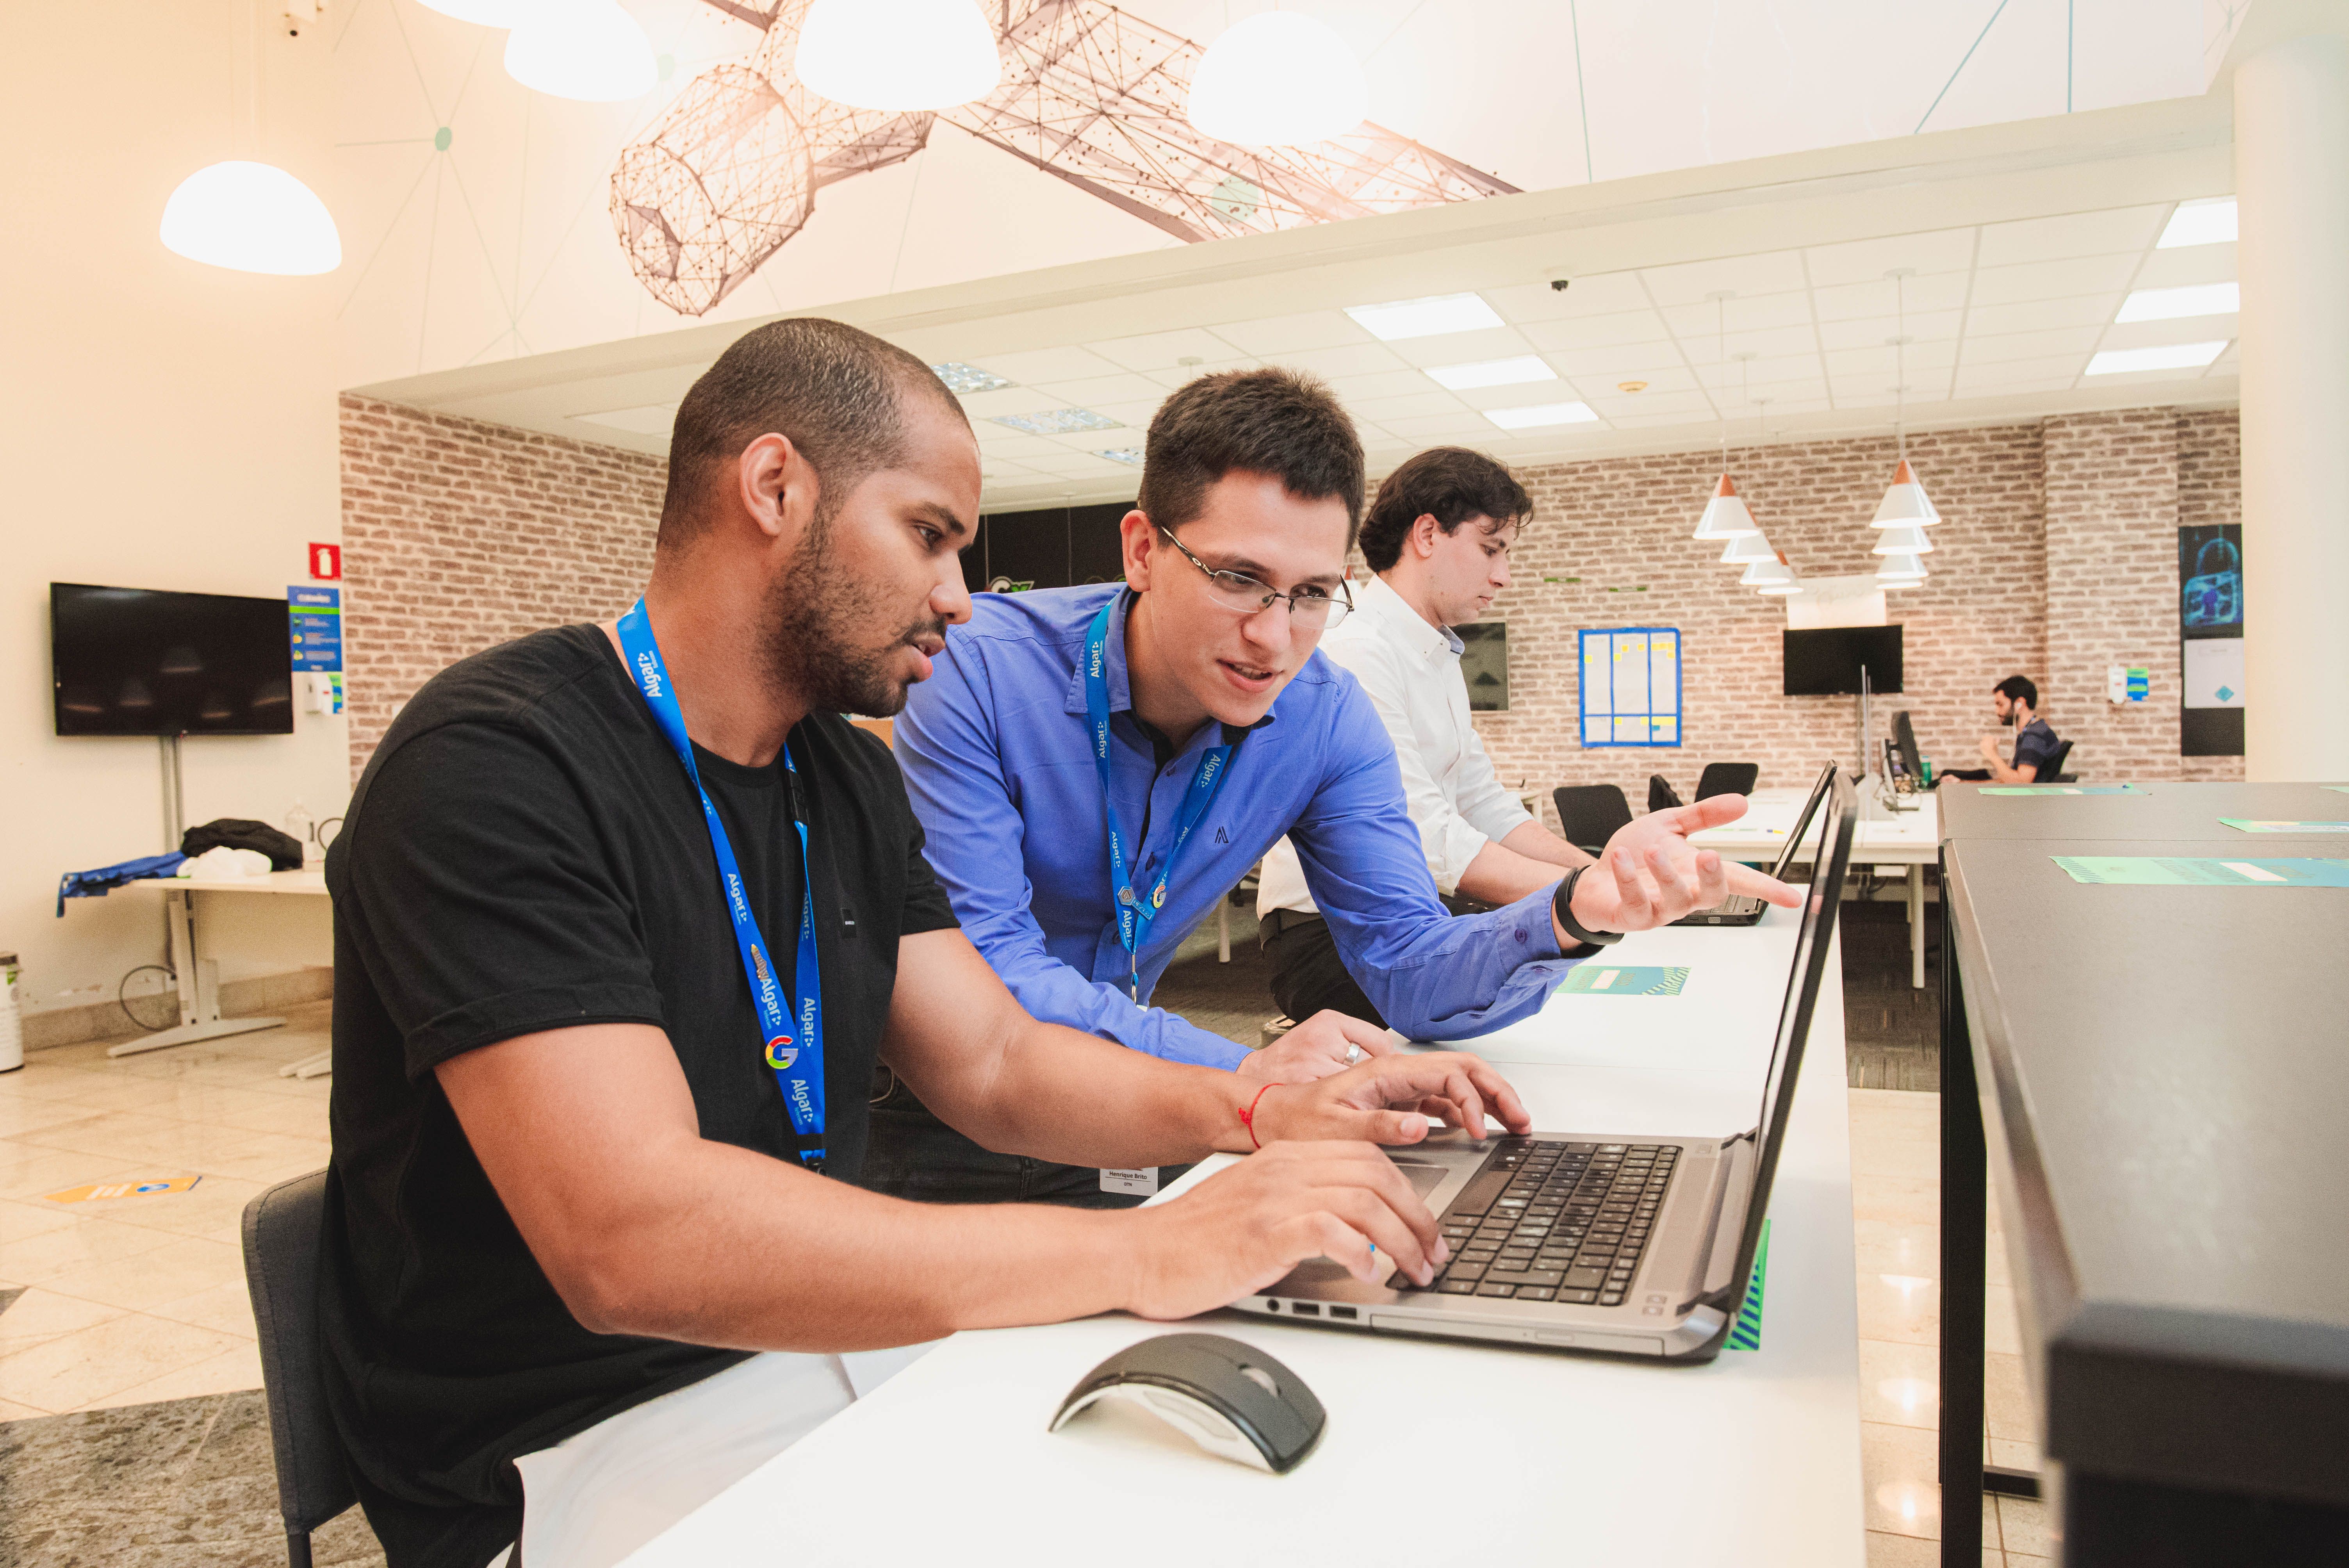
, Uberlandia-MG, BRFulltime - 11/2019 to 06/2022Analytics Tech Lead - 07/2021 to 06/2022
- Responsible for interacting with internal areas of the company, understanding its business contexts and proposing automated analytical solutions, using data visualization tools.
- Delivered more than 20 dashboards in Spotfire on subjects of operational efficiency, systems management, sales results, customer complaints, commissioning, marketing funnel, among others.
- Increased team efficiency by 60% using backlog refinement methodologies. Product backlog building (PBB), Product Canvas, Planning tool.
- Led a team with 6 Data Analysts
Sr Data Analyst - 01/2021 to 06/2021
- Developed and shared new visualization techniques with the team using HTML/CSS.
- Optimized SQL queries and dashboard performance, reducing load time from ~6 hours to ~5 minutes.
- Supported executive reports for C-Level and directors, using Spotfire and Python.
- -Developed People Analytics Spotfire Dashboards, Product Performance, Sales funnel, that impacted +50 internal users
Trainee - 11/2019 to 12/2020
- Worked in HR in the development of turnover models to scale the volume of hiring of commercial consultants, making hiring cycles more effective.
- Implemented an engagement research system using google sheets and app script that was used in engagement feedback in commercial teams.
- Developed employee NPS and TurnOver dashboards that were used in action plans.

Bussola Digital
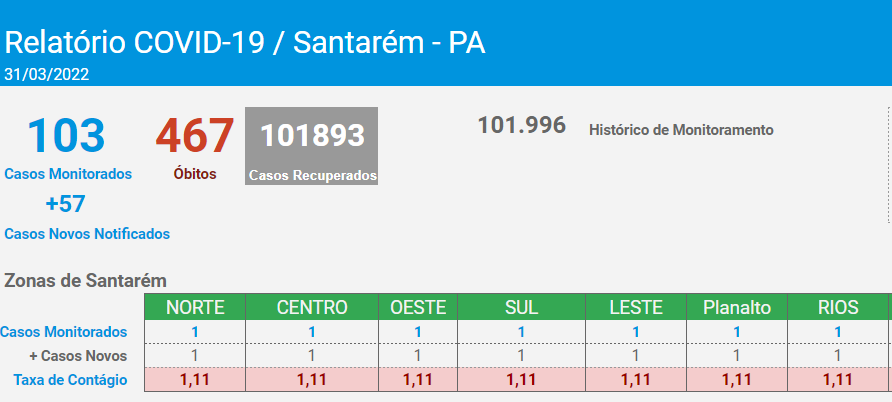
, Santarém-PA, BRCovid Analyst - 05/2020 to 12/2021
- Developed a script in R to calculate the contagion rate, and reported indicators for the Public Prosecutor's Office to collaborate in the decision of whether or not to have a Lockdown in two municipalities.
- other desc

EITESAL NGO
, Cairo Governorate, EgyptCairoPart time - InternshipGlobal Entrepeneur - 01/2019 to 03/2019
- Using 3D printing and Design Software, designed an electromechanical component in an Egyptian Statup. Got experience with the Arab culture and used English as the main language.